![Automated Machine Data Collection for Manufacturing [MB]](https://www.infopulse.com/uploads/media/banner-1920x528-how-to-set-up-automated-machine-data-collection-for-manufacturing.webp)
How to Set Up Automated Machine Data Collection for Manufacturing
The manufacturing sector heavily relies on big data to create lean production plans, estimate production capacities, optimize yields, and minimize waste. Much of this data is digitally generated, yet but oftentimes remains siloed across different systems. Implementing automated data collection and aggregation for analysis is thus critical to unlock richer operational insights.
What Is Automated Data Collection and Why It Is Critical for Manufacturing
Automated data collection means using digital technologies to aggregate data from different systems, ranging from connected equipment and sensors to GPS systems and manufacturing execution systems (MES).
Few manufacturers today rely on manual machine data collection. Modern manufacturing equipment includes a range of sensors to track production capacities, temperature conditions, and a multitude of other operating parameters. However, these data points are often only accessible through the equipment’s human-machine interface (HMI) and cannot be easily consolidated with other insights in an enterprise planning resource (ERP) system, for example.
Across the manufacturing ecosystem, many systems lack interoperability, including shop-floor software, connected production systems, and control systems due to different communication protocols and data formats across systems. Likewise, legacy vendor-specific technologies do not support modern open standards and integration protocols like RESTful API.
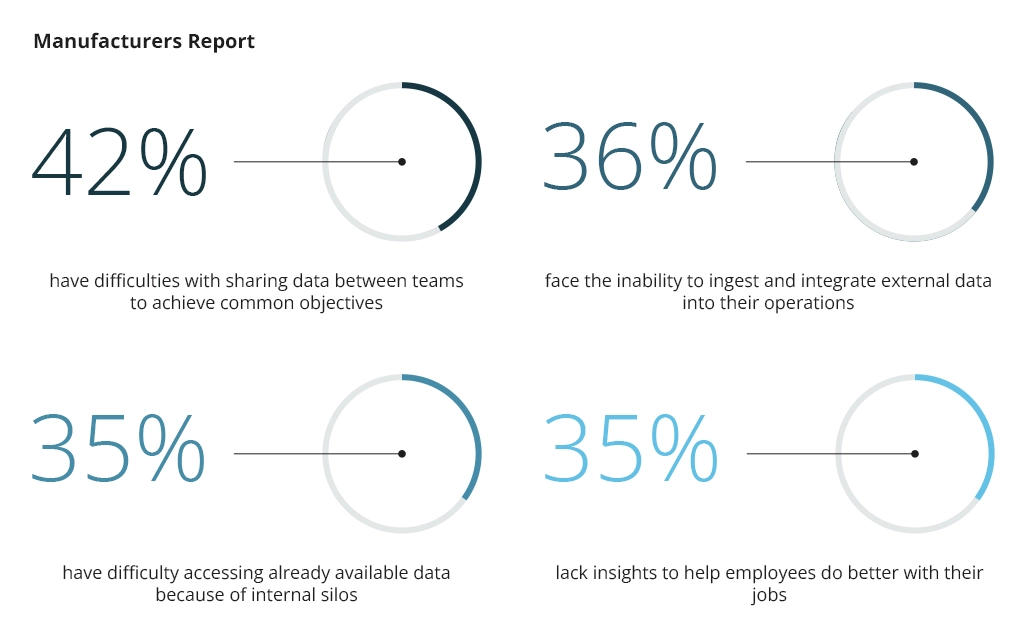
As a result, isolated data repositories accumulate across different departments, limiting process visibility and operating efficiencies. A 2024 global survey by Hexagon found that 98% of manufacturing businesses report at least one major issue with data collection, stifling their operating speeds and the ability to innovate.
Properly engineered automated data collection systems help establish scalable data collection pipelines to aggregate data from downstream systems, apply the necessary transformations for subsequent processing, and upload it to a cloud storage system — a data lake or a data warehouse (DHW), from where it can be queried with various analytics tools.
How Automated Data Collection Works
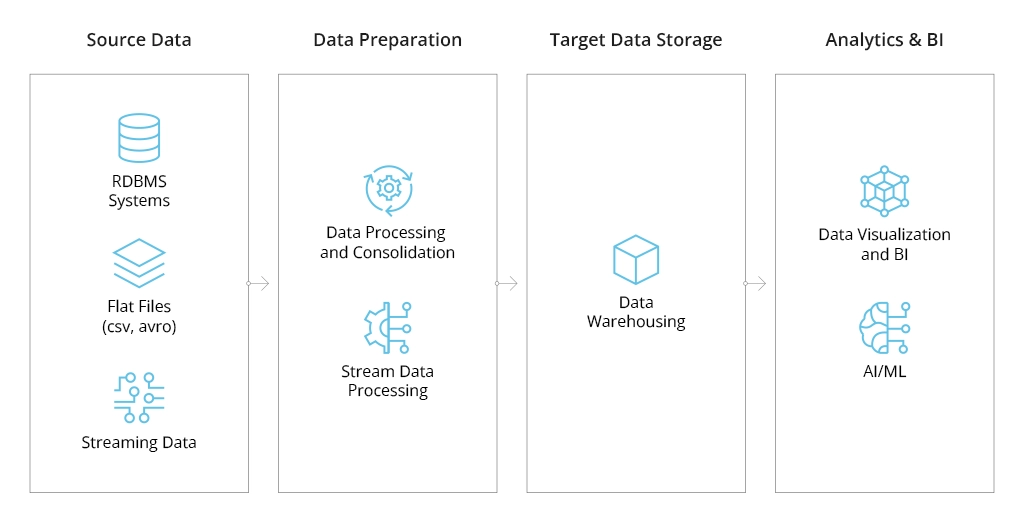
Fundamentally, an automated data collection system has three components: data sources, data processing layer, and data storage layer.
Manufacturing companies are mostly interested in aggregating two types of data: machine data and production data.
Machine data includes information produced by equipment, devices, and sensors during their operation and interaction such as:
- System log data
- Maintenance records
- Energy consumption
- Equipment diagnostics logs
- Geotag data
- Temperature data
When operationalized, this data provides extra insights into the flow and timing of production processes, their efficiency, and compliance with applicable regulations (e.g., proper temperature control during food processing).
Production data, in turn, provides information about the creation, assembly, and output of goods in a manufacturing process. It includes:
- Output volumes
- Production rate
- Average cycle time
- Yield rate
- Uptime/downtime
- Defect rates
- Raw resource consumption
- Order fulfillment rates
- Utility consumption
Some manufacturers are also collecting extra environmental, social, and governance (ESG) data for sustainability purposes. For example, to measure and offset carbon emissions, reduce raw resources spoilage or waste, or provide greater product traceability insights to the end-consumers and investors.
Machine and production data can be structured, semi-structured, and unstructured.
Structured data is organized in a predefined format (schema), which makes it easy to query with business analytics software. Semi-structured data doesn’t have a strict schema but contains certain markers for separating elements.
Unstructured data like images, videos, or written text, does not have a predefined structure. It requires further extensive transformation to become suitable for analysis using methods like optical character recognition (OCR), computer vision, or natural language processing (NLP) in the case of handwritten documents.
Data pipelines help transport structured, semi-structured, and unstructured data from the root source (i.e., the device or system that produces it) to the designated storage location while applying the necessary transformations en route.
Depending on the source data format and your machine data collection software configurations, you may need to program specific rules for data preparation. These may include:
- Schema application
- Format conversions
- Deduplication
- Filtering
- Enriching
- Splitting
The most common type of data pipelines is the Extract, Transform, Load (ETL) pipeline, where data transformation happens before uploading it to the cloud storage system. ETL pipelines are primarily used for transporting structured data to relational database management systems and/or traditional data warehouses that support online analytical processing (OLAP).
Extract, Load, Transform (ELT) is an alternative approach that allows ingesting data in any format to the storage location and then applying transformations. ELT makes it easier to process large data volumes of both structured and unstructured data.
Many big data analytics scenarios in manufacturing assume batch processing, i.e., pushing new data through the pipeline at a pre-set interval (e.g., every hour or once per day). For example, you may want to aggregate all resource consumption after each production shift to evaluate consumption rates and place new supply orders. Likewise, you may choose to collect data from the temperature sensors every hour, rather than every minute if you only need to monitor average temperature. Batch processing helps optimize cloud data infrastructure costs, plus increase analytics speeds due to lower resource demands.
On the other hand, certain use cases, like quality defect detection using computer vision require real-time data streaming.
Technologies like Apache Kafka Streams and Apache Flume allow applying data transformations (filters, aggregation, deduplication, etc.) as the data moves through the pipeline so that it arrives at the target storage location in an analytics-ready state. In this case, transformations are event-driven — applied immediately as new raw data becomes available in the source system. Streaming pipelines eliminate latency and enable real-time analytics scenarios.
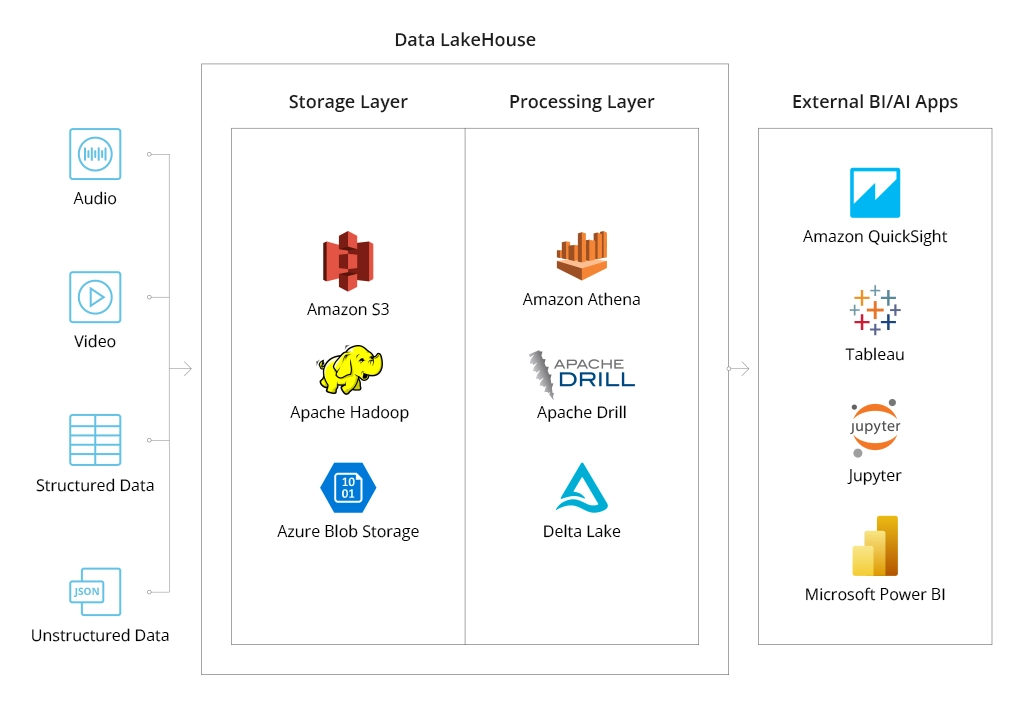
The last key component of an automated data collection system is a storage layer — typically, a data warehouse (DHW) or a data lake. DHWs are primarily suited for storing structured data with an applied schema, from where it can be uploaded to connected business intelligence tools or streamed to ERP software.
Data lakes primarily host unstructured and semi-structured data as they do not impose schema application. This also makes data lakes more scalable and cost-effective than DWHs. Yet, querying them requires more effort.
Generally, manufacturers opt for a hybrid architecture, combining data warehousing and data lake solutions. DWH is usually used as a hot storage location, from where data can be queried almost immediately. Data lakes are used as secondary sites, where unprocessed data gets stored before analysis or retained for a certain period for compliance purposes.
You can learn more about the benefits of Azure, AWS, and Google Cloud for big data analytics projects from our previous post.
Using Modern Technologies for Automated Data Collection and Processing
Although digital transformations in the manufacturing sector have been underway for a couple of years, the process is still far from being complete. A 2023 survey by Parsec found that 31% of US manufacturers who completed their digital transformation initiatives still collect at least some data using analog methods.
Manual data collection often remains the only option when no direct integration is available with legacy software systems or production equipment. Likewise, some processes are also impossible to digitize with off-the-shelf automated data collection software.
The better news is that emerging digital technologies like the industrial Internet of Things (IoT) devices, optical character recognition (OCR), and computer vision at large can help address these constraints.
Industrial IoT
The average cost of sensors in manufacturing has dropped by almost three times since the start of this century to just $0.44. The Internet of Things can be used to collect real-time data from industrial assets that lack native capabilities to collect parameters such as temperature, pressure, humidity, vibration, and energy consumption levels.
Sensor data provides extra visibility into the production processes and equipment operations, enabling performance anomaly detection — a key step for predictive maintenance. Aggregated sensor data can be analyzed with machine learning algorithms, trained to detect early signs of performance deterioration or predict defect rates. Infopulse team recently helped a steel and mining conglomerate deploy a predictive analytics model for product defects. With the new data processing infrastructure and a SAP-based analytics model, the company can predict the probability of slab defects based on product parameters, such as steel grade and gauge of sheets. This capability decreased the costs of defect detection and increased production volumes by 250-300 steel sheets per month through more efficient process planning.
IoT devices, combined with other image and video capture technologies, are also used to build digital twins in manufacturing — digital replicas of industrial assets or entire manufacturing processes, powered by real-time data. Digital twins enable real-time process optimization, advanced product modeling, and supply chain optimizations among other benefits.
OCR
Optical character recognition (OCR) for recognizing and extracting texts from different mediums: Scanned PDF documents, handwritten notes, images, videos, or physical equipment interfaces. Moreover, the new OCR sub-types include:
- Optical mark recognition (OMR) — instant scanning of checkboxes or other marked fields on the presented asset.
- Magnetic ink character recognition (MICR) — character reading of inscriptions, made with magnetic ink.
- 1D and 2D barcode recognition (BCR) — decoding of information included in one-dimensional (e.g., UPCs) or two-dimensional (e.g., QR codes) barcodes.
Effectively, OCR transforms the extracted text into a machine-readable format, making it available for analytical systems. For manufacturers, OCR can streamline hundreds of hours spent on manual data entry of new part numbers and serial codes, inspection results from checklists on production forms, or shipment tracking.
Case in point: Infopulse team helped a German manufacturer implement a convolutional neural network to streamline data collection from a legacy system. Replacing the old gauge equipment would have led to substantial capital expenditure, but the company needed these data to support its predictive maintenance program, powered by an IoT platform. Our team trained a CNN to accurately recognize gauge digits from a 7-segment LCD despite the possible interferences (glare, reflections, etc). The staff can take measurements in less than 2 seconds using a hand-held device, with captured data immediately being sent to the cloud for further processing and analysis.
Computer Vision
Computer vision includes a broader range of technologies that allow machines to interpret visual inputs (real-time video and images) and perform pre-programmed tasks. For example, detect flaws in product packaging, sort different parts on the conveyor belt based on visual characteristics, or provide spatial awareness to industrial robotic systems.
The definite advantage of automated data collection with computer vision is a new pane of insights manufacturers can collect:
- dimensional measurements,
- textual and color analysis,
- positioning and alignment.
Likewise, computer vision also enables more precise workflow monitoring, allowing leaders to optimize inefficiencies in equipment configuration, optimize tooling layouts, or improve employee safety through automatic rule enforcement.
Thanks to recent advances in generative AI, manufacturers can adapt existing computer vision models to their use cases using fine-tuning — a more cost-effective technique than training a custom computer vision model from scratch.
Conclusion
As data volumes grow and more workflows get digitized, manufacturers risk getting hit by an avalanche of incoming data that commands high storage costs but generates little value for the manufacturing business.
Automated data collection requires a thoughtful approach to data architecture design with appropriately selected data sources, robust data processing pipelines, and an optimized cloud storage layer. Infopulse helps global businesses implement smart insights processing. We provide technology consulting and end-to-end data analytics implementation services, covering architecture design, data management processes configuration, self-service, and ad-hoc analytical model implementation.


![Power Platform for Manufacturing [Thumbnail]](/uploads/media/thumbnail-280x222-power-platform-for-manufacturing-companies-key-use-cases.webp)
![Digital Twins and AI in Manufacturing [Thumbnail]](/uploads/media/thumbnail-280x222-digital-twins-and-ai-in-manufacturing-benefits-and-opportunities.webp)

![ServiceNow for Manufacturing [Thumbnail]](/uploads/media/thumbnail-280x222-seven-ways-servicenow-drives-digital-transformation-in-manufacturing.webp)
![Manufacturing Trends 2024 [Thumbnail]](/uploads/media/thumbnail-280x222-manufacturing-trends-that-will-shake-the-world-in-2024.webp)

![Challenges of Big Data Analytics [thumbnail]](/uploads/media/thumbnail-280x222-challenges-to-consider-before.webp)
![Big Data Platform on Google Cloud Platform [thumbnail]](/uploads/media/thumbnail-280x222-why-your-big-data-platform-should-reside-on-google-cloud.webp)
![Data Platforms on Azure [thumbnail]](/uploads/media/thumbnail-280x222-building-data-platforms-microsoft-azure.webp)
![Cloud Data Platforms [thumbnail]](/uploads/media/how-a-cloud-data-platform-helps-unveil-the-outmost-value-of-data-280x222.webp)
![Cloud Data Platforms [thumbnail]](/uploads/media/the-many-faces-of-cloud-cata-platforms-280x222.webp)