![5G Network Holes [MB]](https://www.infopulse.com/uploads/media/1920x528-how-to-detect-and-predict-5g-network-coverage-holes.webp)
How to Detect and Predict 5G Network Coverage Holes
Why 5G Coverage Holes Occur
The big “selling point” of 5G connectivity is increased bandwidth due to the usage of high-frequency bands like millimeter waves (mmWave). Higher bandwidth means faster data transfer speeds, ultra-low latency, and support for high data rate applications like computer vision, extended reality, or industrial automation.
Yet, high-frequency bands have a shorter transmission range, are more susceptible to obstacles and interference, and require more base stations for adequate area coverage. All of these factors result in coverage holes and hindrances in user experience.
Coverage holes (CH) occur when the serving cell's signal is insufficient to provide basic services, leading to call drops, radio link failures, and complete signal access. Naturally, this undermines customer experience.
Some of the common reasons for 5G coverage holes include:
- Physical obstacles like high-rise buildings or terrain elements
- Insufficient infrastructure coverage in the area
- Land loss and subsequent tower demolition
- High electromagnetic interference (EMI) from nearby objects
- Challenging weather conditions like heavy rain or fog
- Network congestion during peak usage times
Some of these factors must be considered at the network planning stage. Others proactively managed with the help of analytics tools post-deployment.
Why Coverage Network Hole Detection Is Challenging
Coverage holes can be static, i.e., such which the operator is aware about. These mostly occur in remote sparsely populated areas, where extra infrastructure construction for network deployment is not always economically viable. Or in areas where signal reliability is traditionally challenging to achieve like elevators, shafts, basements or underground parking lots.
However, most CHs are fluid in nature, i.e., they are triggered by some underlying event such as poor weather, a major sports event in a city, or a user riding on a high-speed train through a rural area.
Knowing when and why signal loss occurs is important for delivering seamless service levels. Yet, it is challenging to approximate the exact user geo-location to flag an area with patchy coverage, and it is even harder to track an issue when the subscriber is on the move.
Traditional Approaches to Detecting Coverage Holes in Telecom
Telecom companies apply a range of time-tested methods for detecting coverage holes including network coverage analysis, performance measurements, drive testing, and coverage data crowdsourcing. Each of these has its advantages and limitations.
Network Coverage Analysis
MNOs are to spend over $600 billion on 5G infrastructure setup between 2022 and 2025 to bring better connectivity to users.
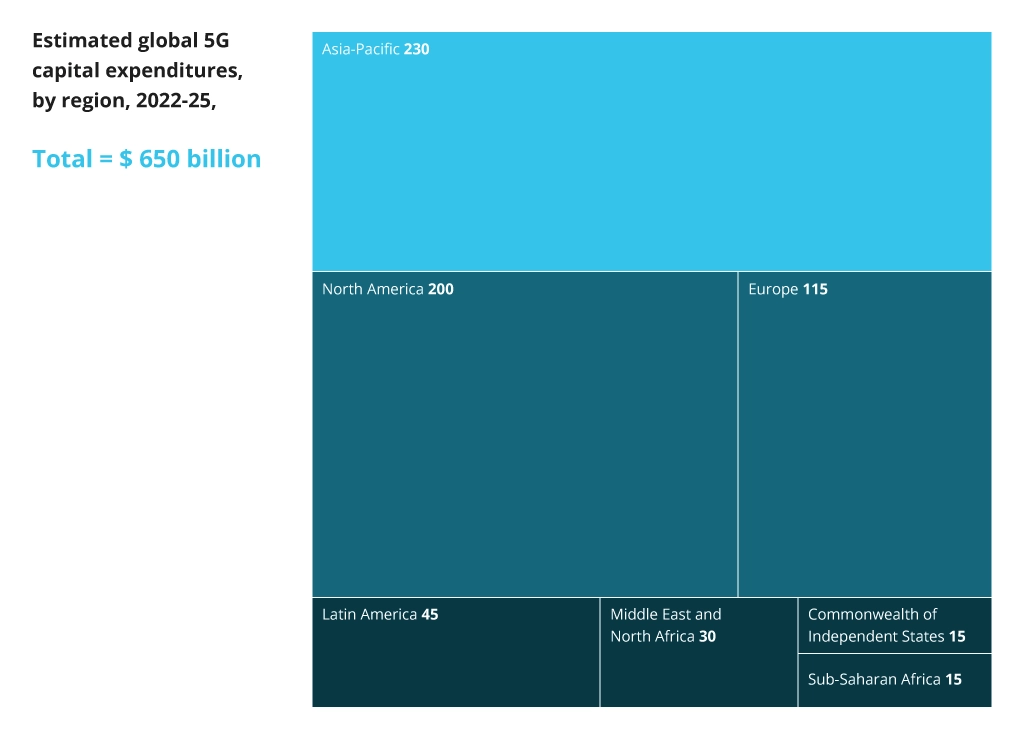
Base station and transmission tower construction demands high capital expenditures. Hence, most companies prioritize areas with the highest demand first — large agglomerations, then smaller towns and main roads, linking these with other municipalities. Global regulators also shape these plans as most have specific requirements on how much population should be covered (e.g., 98%) to start operating in the area. This means that more sparsely populated regions are somewhat deprioritized.
Generally, the network planning process and subsequent coverage analysis require ample geospatial data connection. A comprehensive geospatial data set can contain over a billion records, describing:
- Elevation and terrain data
- Land use and land cover information
- Geo-coordinates of existing cell towers and base stations
- Population density and distribution
- Building heights and infrastructure layout
- Road networks and transportation infrastructure
- Environmental factors like vegetation indexes and water bodies
- Administrative boundaries and zoning information
Moreover, these datasets should be complemented by extra data on signal strength and quality measurements, collected with the help of drive tests, specialized network testing tools, or crowdsourcing.
Drive Tests
Drive tests, physically driving through specific areas with measurement equipment, are the common way to evaluate network performance. During a test, the team measures:
- Signal Strength (RSSI/RSRP) — the power level received by the used mobile device.
- Signal Quality (SINR/RSRQ) — the quality of the received signal, factoring in interference and noise.
- Call drop rate frequency and handover success rate — the efficiency of transitioning calls or data sessions between cells.
- Throughput levels, i.e., data transfer rates for upload and download, as well as latency.
- Jitter levels — variability in packet delay at the receiver’s end.
Although drive tests allow MNOs to effectively measure the quality of service from the user’s perspective and identify problematic areas, they are also resource-intensive. In response to a regulatory demand by the Federal Communications Commission, AT&T estimated that drive testing 25% of the square kilometers of its nationwide coverage would cost about $45 million each year.
Even in relatively small areas, drive tests require considerate human resources and preparation. Yet, the test data may not be conclusive as network performance can be affected by dynamic factors like weather.
Network Quality Data Crowdsourcing
An alternative way to drive tests is crowdsourced 5G network quality data collection. An MNO may partner with a navigation app provider, for example, to collect more accurate data on signal quality.
A navigation app needs location data (latitude, longitude) to work properly and it gathers this data from a GPS receiver, built into the user's mobile device. User equipment (UE) gives very accurate positioning data of up to 3 to 5 meters. The app also needs mobile data for real-time routing and traffic condition reporting, meaning there’s a continuous data exchange. Any interrupted connectivity indicates a possible network hole for data transmission.
Effectively, a navigation service provider can provide the MNO with the exact timestamp and location of the mobile device (once it’s back online). This data can then be used to create precise cellular coverage maps.
In regions, where privacy regulations permit, MNOs can also use other methods for minimization of driving tests (MDTs) such as:
- Real-time data collection from all users when they are active on their devices
- Selective data collection, targeting specific geo areas or pre-defined conditions
- Event-based data collection, triggered by specific network events or performance threshold
Of course, all of this data must be obtained with the users’ permission and then properly anonymized and secured to stay on the good side of compliance.
Signal Strength Measurements
Last, but not least, MNOs need to have accurate signal strength data, both historical and real-time, to understand the quality of 5G networks. Traditionally, this data is collected using a combination of static tests (with measurement equipment, fixed at specific locations), probe deployment within the network infrastructure, and powerful telecom data analytics solutions.
In particular, MNOs collect metrics like:
- RSSI (Received Signal Strength Indicator): Indicates the power level that a mobile device receives from a wireless transmission. RSSI is typically measured in decibels milliwatts (dBm) and is a negative value. Higher RSSI values indicate better signal strength. Values typically range from -120 dBm (very weak signal) to -30 dBm (very strong signal). Overall, it gives a general sense of signal presence but doesn’t indicate noise and interference levels.
- RSRP (Reference Signal Received Power): Measures the average power level of the reference signals received by a mobile device. RSRP is measured in dBm and, like RSSI, is a negative value. Higher RSRP values indicate better signal strength. Typical ranges are from -140 dBm (very poor signal) to -44 dBm (excellent signal). Generally, RSRP provides a more focused measure of signal strength by isolating the reference signals.
- RSRQ (Reference Signal Received Quality): Combines RSRP and the RSSI to indicate the power of the reference signals, level of interference/noise, and the quality of the received reference signal. RSRQ is measured in dB and is usually a negative value. Typical ranges are from -19.5 dB (very poor quality) to -3 dB (excellent quality).
- SINR (Signal-to-Interference-plus-Noise Ratio): Compares the level of the desired signal to the level of interference and background noise. High SINR values indicate a strong signal. It gives operators more visibility into the presence of various interferences in the area (buildings, vegetation, etc.) and noise (e.g., high EMI from nearby power lines).
Having a representative backlog of RSSI, RSRP, RSRQ, and SINR measurements from various locations and conditions is necessary for identifying and predicting 5G coverage holes.
How Machine Learning Helps Identify and Predict 5G Network Holes
Machine learning (ML) algorithms excel at processing large data volumes. This is helping your teams make more sense from the collected signal strengths measurements, driver tests, or crowdsourced insights.
In particular, the two areas where machine learning algorithms can help telecoms are anomaly detection and time-series predictions.
Anomaly Detection
To use machine learning for predicting network coverage holes, telecoms must first establish specific parameters for describing one. These could be:
- Signal strength below an acceptable threshold
- High packet loss
- Low data throughput
The next step is to build a dataset for training the model to properly classify different events, collected during the MDT process, as anomalies with a low number of false positives and false negatives. There are different supervised and unsupervised machine learning methods, suited for the task.
One group of researchers created a dataset that included RSRP, geo coordinates, timestamps, cell identity, and SINR data to train a semi-supervised algorithm for detecting coverage holes. The algorithm successfully identified anomalies with 94%, which could be further improved by increasing the amount of provided labeled data. Another research group used a supervised ML classifier to detect 5G network holes, based on latency and packet loss rates.
Generally, the optimal algorithm selection will depend on the type, accuracy, and variability of the data you can collect, as well as accuracy performance thresholds.
Time-series Prediction of 5G Hole Coverage
Machine learning algorithms have also shown strong results in various prediction tasks — from sales volumes to production defect rates. With sufficient data, these time-series predictions can also be applied to 5G network holes.
Specifically, you can use RSSI, RSRP, RSRQ, and SINR measurements from various locations and conditions as features in an ML model. A feature is an individual measurable characteristic of the data used for model training and making predictions. For greater prediction accuracy, you can use extra parameters like geospatial data (buildings, terrain, vegetation), weather data, or historical network performance data.
Scientifically, it is already possible to train an artificial neural network to predict wireless coverage maps for 5G networks with high accuracy. The commonly used modeling techniques include Radial Basis Networks (RBN), sigmoid-based artificial neural networks, and K-nearest neighbors methods, which predict the signal-to-interference ratio (SIR) of points in the map by using the SIR of their neighbors.
After evaluation, the best-performing model can be integrated into the network management system, allowing NOC teams to plan more timely interventions. The data also helps to make more informed network planning decisions, leading to optimized costs and higher service quality.
Final Thoughts
Poor 5G network coverage makes customers question the higher price tag for their service. Negative sentiment, in turn, slows down the adoption and extends the payback period for newly constructed infrastructure.
By investing in more modern approaches to coverage hole analysis — MDT datasets, big data analytics, and machine learning algorithms — MNOs can bring extra efficiencies into their network planning processes and deliver superior customer service at a leaner cost.

![CX with Virtual Assistants in Telecom [thumbnail]](/uploads/media/280x222-how-to-improve-cx-in-telecom-with-virtual-assistants.webp)
![How to Reduce Churn in Telecom [thumbnail]](/uploads/media/thumbnail-280x222-how-to-reduce-churn-in-telecom-6-practical-strategies-for-telco-managers.webp)
![AI in Telecom [Thumbnail]](/uploads/media/thumbnail-280x222-ai-in-telecom-network-optimization.webp)

![Telecom Tech Trends [Thumbnail]](/uploads/media/thumbnail-280x222-what-is-hot-in-telecom-nine-tech-trends-to-impact-the-industry-in-2024.webp)
![Telecom Challenges into Opportunities with Consulting [thumnbail]](/uploads/media/thumbnail-280x222-telecom-challenges-into-opportunities-consulting.webp)