![Azure Monitor for SAP [banner]](https://www.infopulse.com/uploads/media/banner-1920x528-azure-monitor-for-sap-solutions-an-overview.webp)
Azure Monitor for SAP Solutions: An Overview
What Is Azure Monitor?
Azure Monitor is a set of monitoring tools that aggregate telemetry data from connected systems for quicker diagnosis and troubleshooting. Featuring a collection of data visualization tools, real-time alerts, and built-in analysis features, Azure Monitor provides a unified view and analysis of all the ingested data from distributed environments.
Azure Monitor can collect telemetry data from all the components of your Azure infrastructure, as well as on-Azure subscriptions & tenants and on-premises deployments. Moreover, Azure Monitor has native integration with SAP, allowing organizations to monitor all SAP applications and business processes that rely on Azure resources or even hybrid SAP S4/HANA deployments for availability and performance.
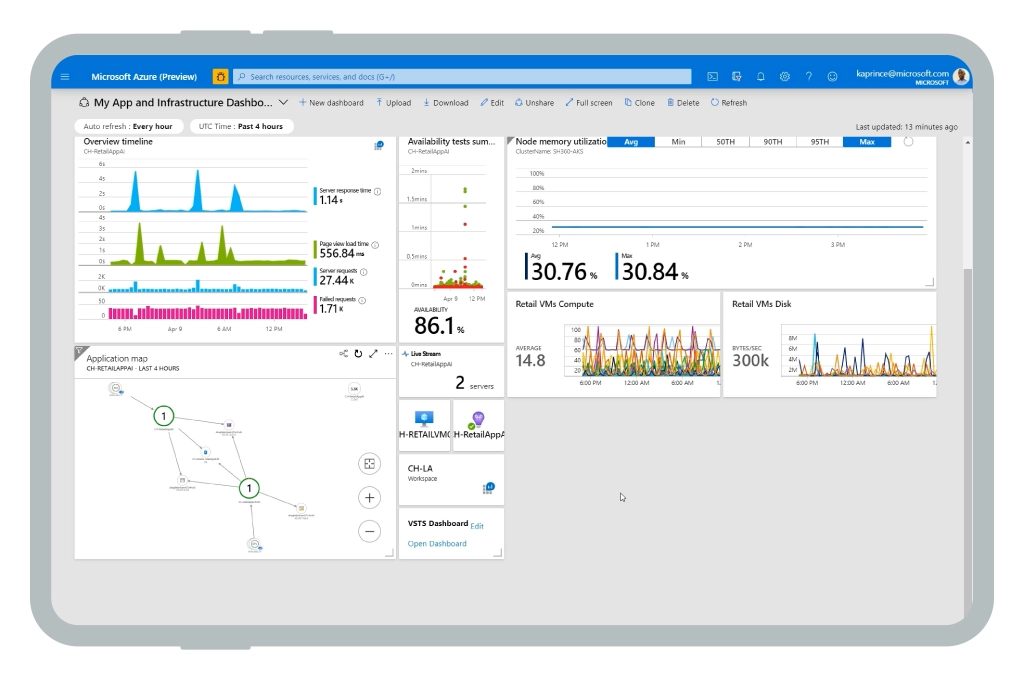
It helps infrastructure administrators locate performance issues, auto-scale resources, and optimize SAP solutions performance to ensure a seamless user experience. For example, if users experience slow transaction processing times, an administrator can quickly locate the possible issue via the dashboard, diagnose the cause, and resolve the problem.
Azure Monitor for SAP solutions enables IT infrastructure monitoring teams to:
- Create custom data visualizations and monitoring dashboards to gain real-time insights into SAP system performance and health.
- Write custom queries using the Azure Log Analytics tool to establish custom data collection rules, optimize data processing, or run ad-hoc analysis.
- Set up custom alerting rules and scopes to zoom in on critical issues and ensure effective alert prioritization.
- Benefit from a flexible retention period of 30 to 730 days in Azure Monitor Logs and Log Analytics.
- Stream monitoring data into your ticketing system to create more detailed issue descriptions and ensure faster resolution times.
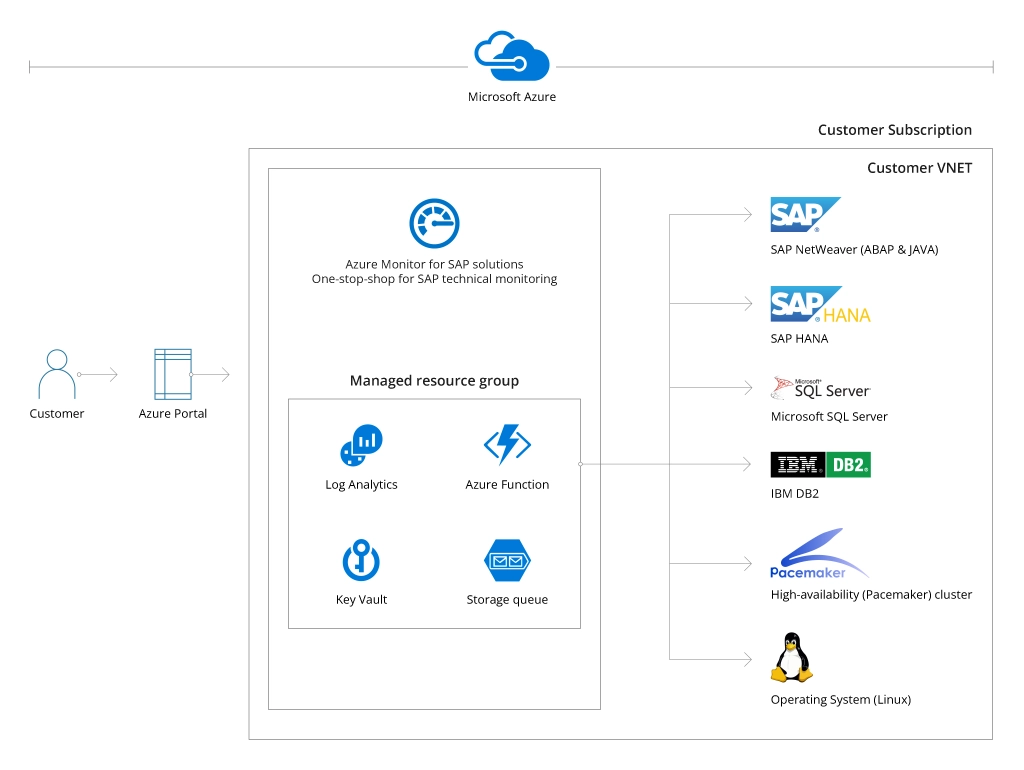
Azure Monitor for SAP Solutions: Sample Architecture
With Azure Monitor for SAP solutions, you can collect data from all system components in one place and visually correlate it to speed up troubleshooting. Teams can monitor:
- HANA databases (e.g., CPU, memory, disk, network use; host status, system replication, backup status, database growth, etc).
- High-availability (HA) clusters (e.g., node, resource, and SBD status; location constraints, etc).
- Microsoft SQL Servers (e.g., batch requisitions and compilations; CPU, blocking processes and SQL wait statistics; SQL Server error logs).
- SAP NetWeaver data (e.g., instance process availability of dispatcher, ICM, gateway; work process usage statistics, system logs, and SMON metrics).
Naturally, Azure Monitor also collects availability and performance metrics from all Azure VMs and Azure instances, assigned to SAP applications and databases.
Additionally, Azure Monitor integrates with Microsoft Sentinel — a cloud-native security information and event management (SIEM) tool for collecting security analytics. This means that your teams can also keep an eye on potential vulnerabilities and security threats, targeted at your SAP applications.
Why Use Azure Monitor for SAP Solutions
When configured correctly, SAP deployments on Azure can benefit from 99.9% virtual machine availability for systems like SAP Business Suite applications, SAP S/4HANA, and SAP BW/4HANA.
However, SAP on Azure performance may degrade over time due to an increasing number of concurrent workloads or growing data volumes. Azure Monitor helps companies precisely detect when performance bouts occur and administer timely intervention to avoid data corruption, data loss, or gaps in business continuity.
Beyond that, here are four more very good reasons to adopt Azure Monitor for SAP solutions.
Complete Coverage
Azure Monitor consolidates data from all SAP landscape components — VMs, instances, HA clusters, databases, and NetWeaver application server. Your teams no longer need to log in to multiple accounts or create complex queries to obtain event logs and other system telemetry: everything gets neatly aggregated into a designated dashboard.
Tools like Log Analytics also offer a powerful query language (Kusto Query Language) to program custom data retrieval, filtering, grouping, sorting, and merging rules. It allows running custom time-series analysis and pattern-matching scenarios. Lastly, you can detect anomalies using in-built functions or apply custom machine learning models against data to obtain even richer insights, namely the detection of advanced threats.
Azure workbooks, in turn, allow the easy creation of real-time reports and interactive visualizations from collected logs, metrics, and Azure resources. Detailed visualizations help teams run collaborative analyses and speed up root-cause issue detection.
Architectural Harmony
Azure Monitor is specifically designed for observability of the SAP deployments on Azure, offering visibility across all layers:
- Application layer: Azure Monitor allows tracking application performance metrics, logs, and traces (e.g., transaction response times, database response times, user logon times, and dialog work process usage among others).
- Database layer: Gain deep insights into database performance, query execution, and data storage (e.g., disk throughput, CPU usage, cache hit ratio, row processing time, average query complexity, data volume growth rate, etc).
- Infrastructure layer: Monitor all underlying Azure resources (VMs, storage, and network), supporting SAP workloads (e.g., disk I/O operations, CPU usage, network latency, storage utilization, etc).
To monitor all of the above, your teams can use the already familiar Azure tools and services — Azure Functions, Key Vault, Log Analytics, managed resources groups, etc.
This reduces the learning curve for staff who may not be otherwise deeply familiar with SAP’s complex ecosystem. Native integration also makes the setup processes rather streamlined. Administrators can create Azure Monitor for SAP solutions resources via Azure portal or Azure PowerShell.
Convenient Alerting
Azure Monitor provides an ample selection of alerting rules and configurations. You can set:
- Metric alerts to trigger alerts based on pre-set threshold criteria. For example, when SAP S4/HANA database CPU usage exceeds 75%.
- Log alerts, written in Kusto Query Language to cover a limitless range of conditions and system performance characteristics, obtained from log query results. For example: Evaluate the CPU usage average over the last 10 days.
- Activity log alerts notify about changes in Azure resource activities e.g., new resource creation, deletion, or policy change. For example, issue an alert when a new large Azure instance is created for an SAP application.
- Multi-resource alerts allow duplicating the same rule across multiple resources. For example, alert when memory usage across all HANA databases exceeds 80%.
For each type of alert, you can also specify extra conditions like the time aggregation window or the frequency of alert condition evaluation. If you are not sure about appropriate thresholds, Azure Monitor recommends dynamic parameters based on historical data using machine learning algorithms. This also reduces the need for manual adjustments, allowing your teams to direct efforts toward more pressing problems.
Another helpful feature is alert prioritization. You can set up a 4-level severity classification to indicate the urgency of the problem. For scenarios where automatic remediation is possible, you can pre-program automated resolution workflows using Azure Logic Apps or Azure Automation runbooks. A sample scenario may include automatically scaling up resources for an SAP application when CPU and disk usage exceeds 90%. The recently released predictive autoscale feature also allows forecasting the overall CPU requirements of Azure VMs, based on historical trends, and automatically scaling these out.
Highly Affordable
The last massive advantage is that you do not need to purchase a separate license to activate Azure Monitor for SAP solutions. It is a pay-per-use product, where you get billed for log data ingestion, retention, query execution volumes, and alert configurations.
Data ingestion costs vary based on the infested data volumes, measured in GB per day. On the pros side, you can optimize this expense by applying data sampling rules (i.e., limiting log sampling to strictly necessary). You can also apply custom filtering and aggregation rules to reduce data volumes before ingestion.
By default, Azure Monitor retails all aggregated log data for 31 days. However, if you wish to extend storage, charges will apply per GB per month. Payment is also due for all log data exports and data archival to Azure Storage or external services.
Azure provides a lavish free 100 activity log alerts per account and 10 monitored metric time series per month, which should cover most of the monitoring cases for SAP deployments. Extra time-series predictions will cost $0.10/mo. Azure also bills extra for log alters with a higher than 15-minute frequency.
To estimate the total cost of ownership in your specific case, refer to Azure Monitor Pricing Page or get in touch with Infopulse team.
Conclusion
Azure Monitor for SAP solutions provides stellar performance tuning capabilities. With consolidated data, you can cross-correlate logs from SAP applications with Azure infrastructure metrics (or even on-premises resources) to better understand the systems’ health and perform effective troubleshooting.
IT infrastructure administrators can easily identify issues causing long database response times for certain queries and auto-scale Azure VM resources based on real-time SAP workload demands.
Lastly, comprehensive monitoring helps implement proactive capacity planning strategies. For example, optimize workload distribution to minimize latency. Or request Reserved Azure instances for high traffic periods in advance to optimize cloud spending.

![Expanding NOC into Service Monitoring [thumbnail]](/uploads/media/280x222-best-practices-of-expanding-telecom-noc.webp)
![Cloud-Native for Banking [thumbnail]](/uploads/media/cloud-native-solutions-for-banking_280x222.webp)
![Data Governance in Healthcare [thumbnail]](/uploads/media/blog-post-data-governance-in-healthcare_280x222.webp)
![Security Levels [thumbnail]](/uploads/media/thumbnail-280x222-levels-of-enterprise.webp)
![ServiceNow and Third-Party Integrations [thumbnail]](/uploads/media/thumbnail-280x222-how-to-integrate-service-now-and-third-party-systems.webp)
![5G Network Holes [Thumbnail]](/uploads/media/280x222-how-to-detect-and-predict-5g-network-coverage-holes.webp)
![DevOps Adoption Challenges [thumbnail]](/uploads/media/thumbnail-280x222-7-devops-challenges-for-efficient-adoption.webp)
![How to Reduce Churn in Telecom [thumbnail]](/uploads/media/thumbnail-280x222-how-to-reduce-churn-in-telecom-6-practical-strategies-for-telco-managers.webp)
![Automated Machine Data Collection for Manufacturing [Thumbnail]](/uploads/media/thumbnail-280x222-how-to-set-up-automated-machine-data-collection-for-manufacturing.webp)
![Automation Solutions for Food Processing Facilities [thumbnail]](/uploads/media/280x222-automation-in-food-processing-3-types-of-emerging-solutions.webp)